Centiles: Baby Growth Charts
The Centile application allows you to record and edit basic measurements of a child and to generate percentile/centile charts based on these data.
How to use this app?
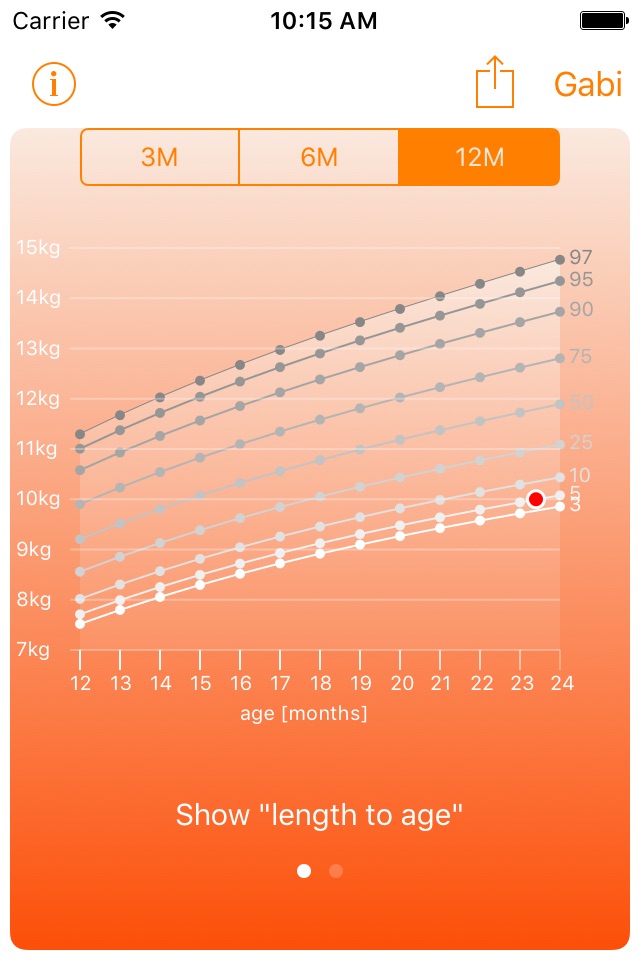
On the childs data screen, enter name, weight and height of a child. Also choose the sex of the baby and its date of his birth. There will be two diagrams generated on the charts screen: "weight for age" and "length for age". To switch between diagrams, use the controls at the bottom of the screen (show "length for age" / show "weight for age").
The horizontal axis of each graph there is age of a child marked (as for today, calculated based on the childrens date of birth). On the vertical axis left hand side, the following is being displayed:
- weigh of the child (in the "weight for age" diagram), expressed in kilograms or
- growth of the child (in the "length for age" diagram), expressed in centimeters.
Besides that, on the vertical axis, right hand side, each of the drawn percentiles is being marked: 3, 5, 10, 25, 50, 75, 90, 95, 97. Various percentiles have also been drawn with the use of a different color (shade of gray). Whitecolor has been used for the 3rd percentile, and the darkest gray for the 97th percentile.
Details of the child (registered / edited on the data of the child), being displayed on each of the charts, are marked with a red dot with a white envelope.
Centile application also provides features like send / do a print out of the currently generated graph - with the use use of default channels, available on your mobile device (for example SMS, e-mail, social networking sites).


